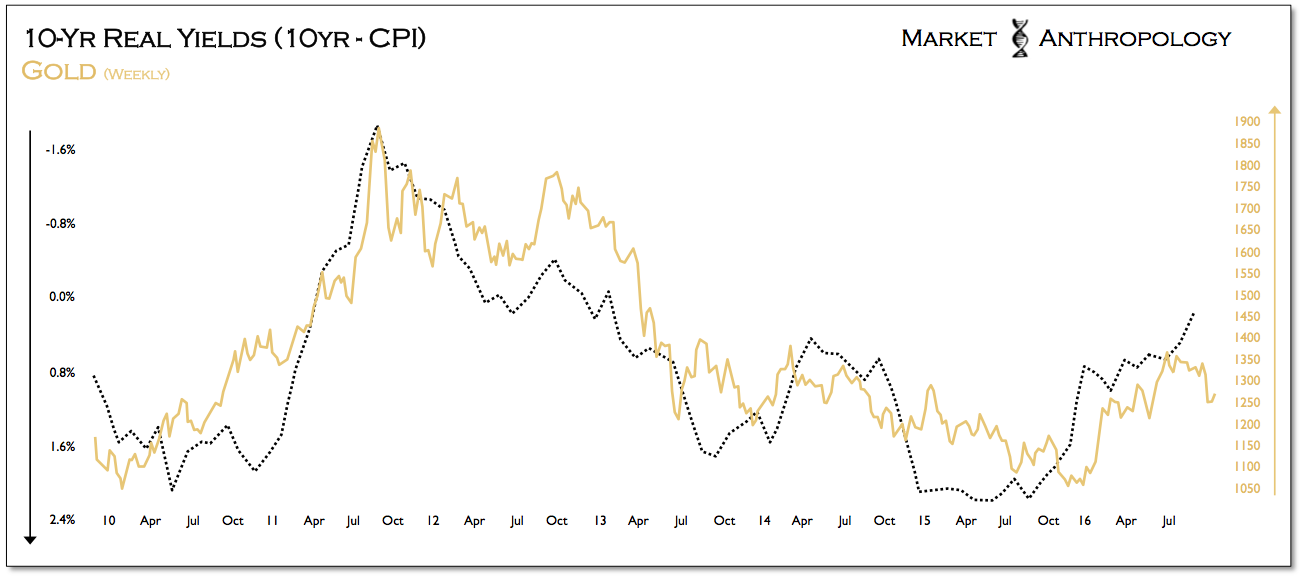
Following up on some points in last weeks note, gold has led pivots in equities for approximately four weeks, which points to a sharp decline in stocks headed into November. To show the relative congruence of the pattern, we broke them both out below with gold’s series set four weeks ahead of the S&P 500.
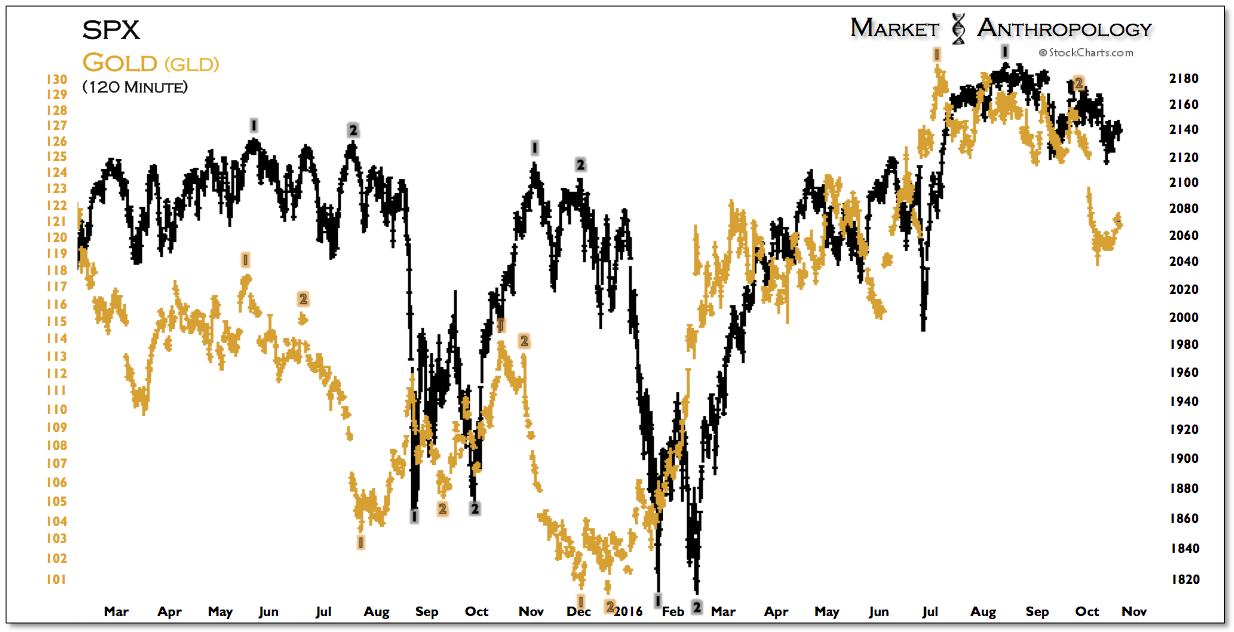
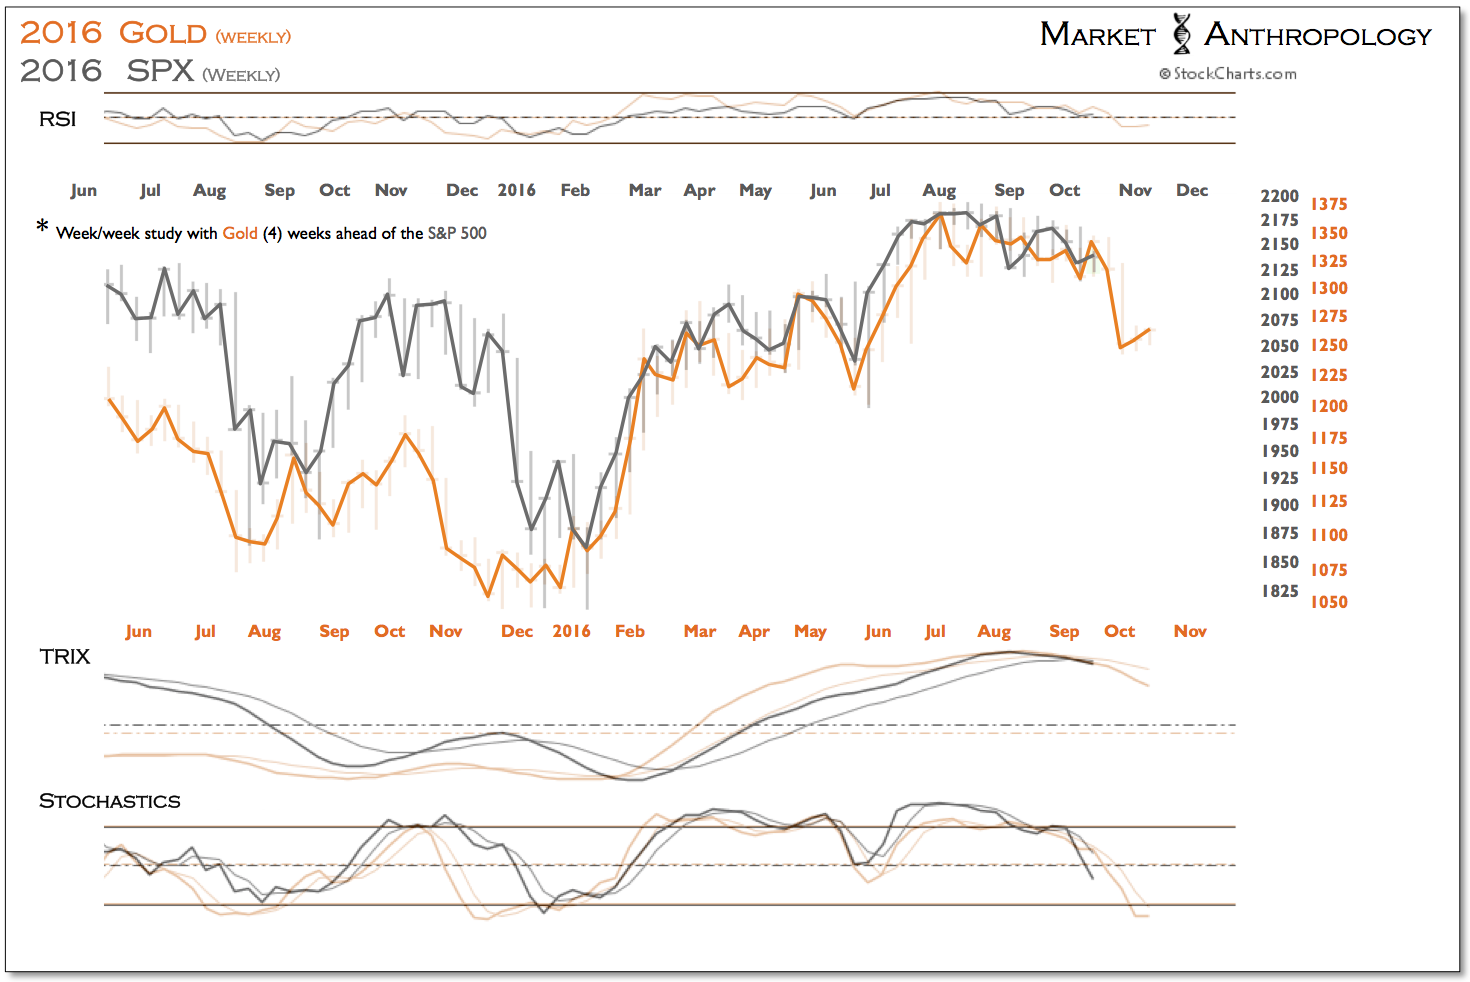
Longer-term, we suspect the primary difference is that as gold has been trading out of a cyclical low late last year, equities have been distributing across a broad top. This dynamic is expressed below by the same study – just weighted through performance, which saw gold marginally underperform the S&P 500 headed into the end of 2015 and consistently outperform equities this year on the way out.
From our perspective, this largely has been driven by the shift lower in real yields late last year that disproportionally benefits assets like gold, with the next chapter largely dependent on how the Fed will handle what we suspect will be rising inflation data and how the market will receive their response with an economic expansion already quite long-in-the tooth. Hint, hint – difficult times ahead.
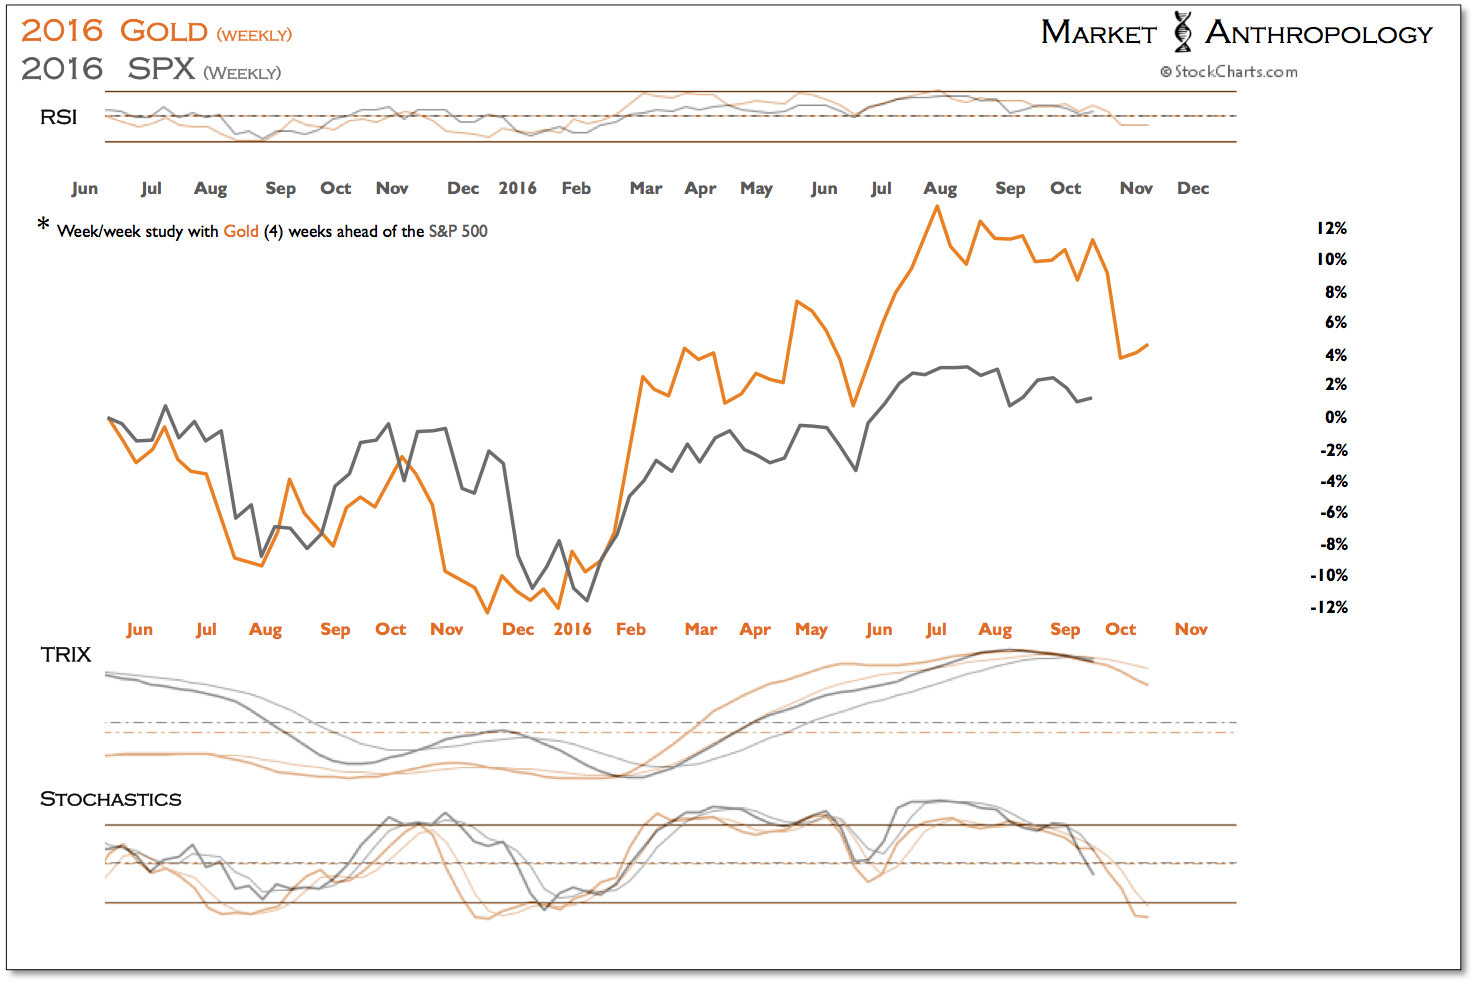
With US inflation data set to rise sharply over the coming months – greatly supported by favorable comparisons to last years oil price decline, real yields are poised to challenge their respective lows from 2011. This week we received the September CPI report that matched headline, but slightly missed core inflation expectations on a month-over-month basis.
That said, distilling the data through real yields, maturities on the long end – as expressed by the 10-year real yield, are on the precipice of joining the intermediate and short end in going negative.
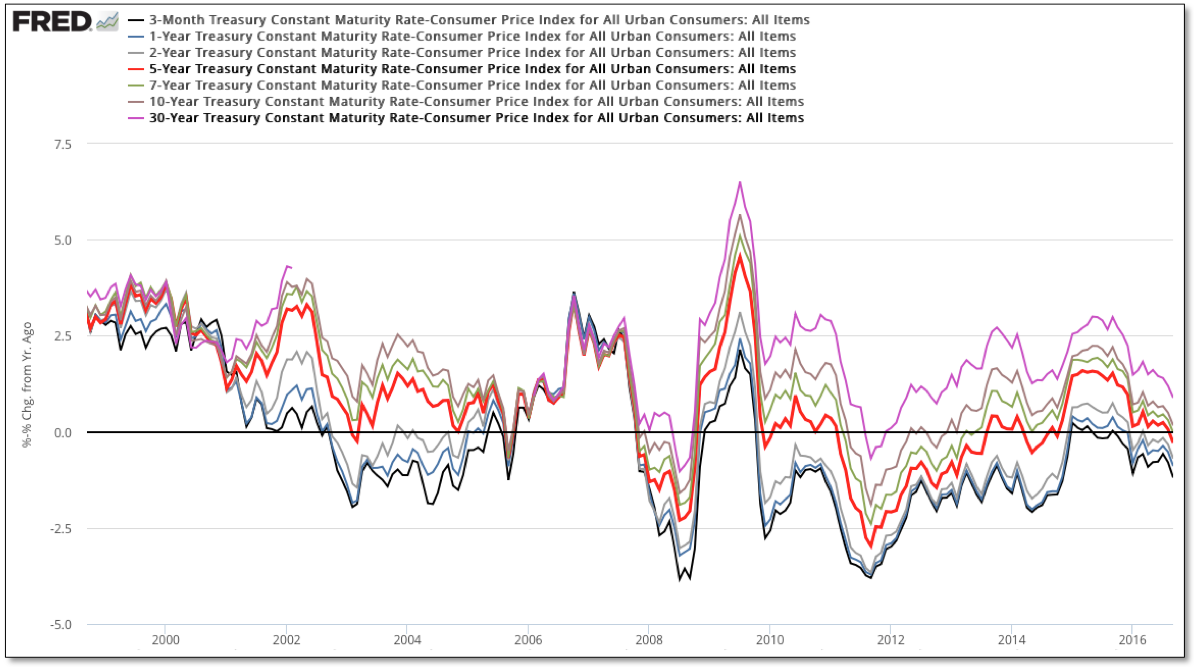
In other words – not exactly a rosy outlook for those Johnny-come-lately safe haven Treasury “investors” who helped push long-term yields to historic lows this year, despite US inflation data that appeared to have turned the corner in the back half of 2015. Moreover, should real yields push even further negative – which we strongly suspect they will (i.e. see late 1940's and 1970's), the swath of Treasury investors adversely impacted by negative real returns would swell appreciably.
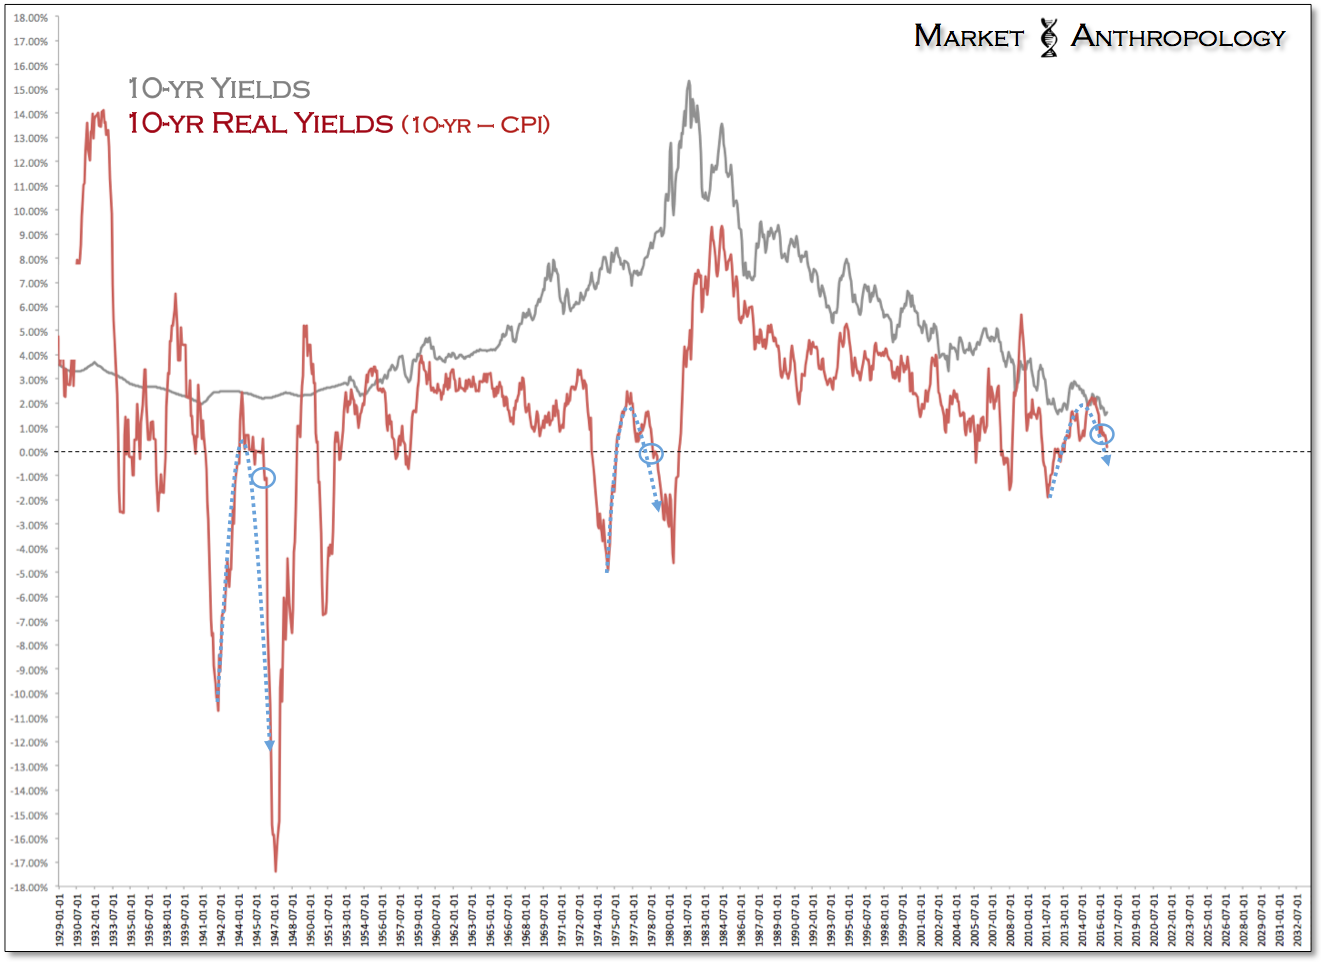
On the flip side of the coin is gold, which as we’ve described in the past carries a strong inverse correlation with real yields. Additionally, it exhibits sharply positive returns in a negative real yield market environment, where the opportunity cost of holding a non-interest bearing asset like gold becomes highly attractive. Furthermore, underlying market psychology is often affected by a broader loss of confidence in monetary policy and/or creditors future returns. From our perspective, we expect both.
